Renewable Energy
Site Suitability Analysis
A end-to-end spatial workflow for identifying and ranking renewable energy development sites — from raw data collection through to polished visualisations and analyst-ready outputs.
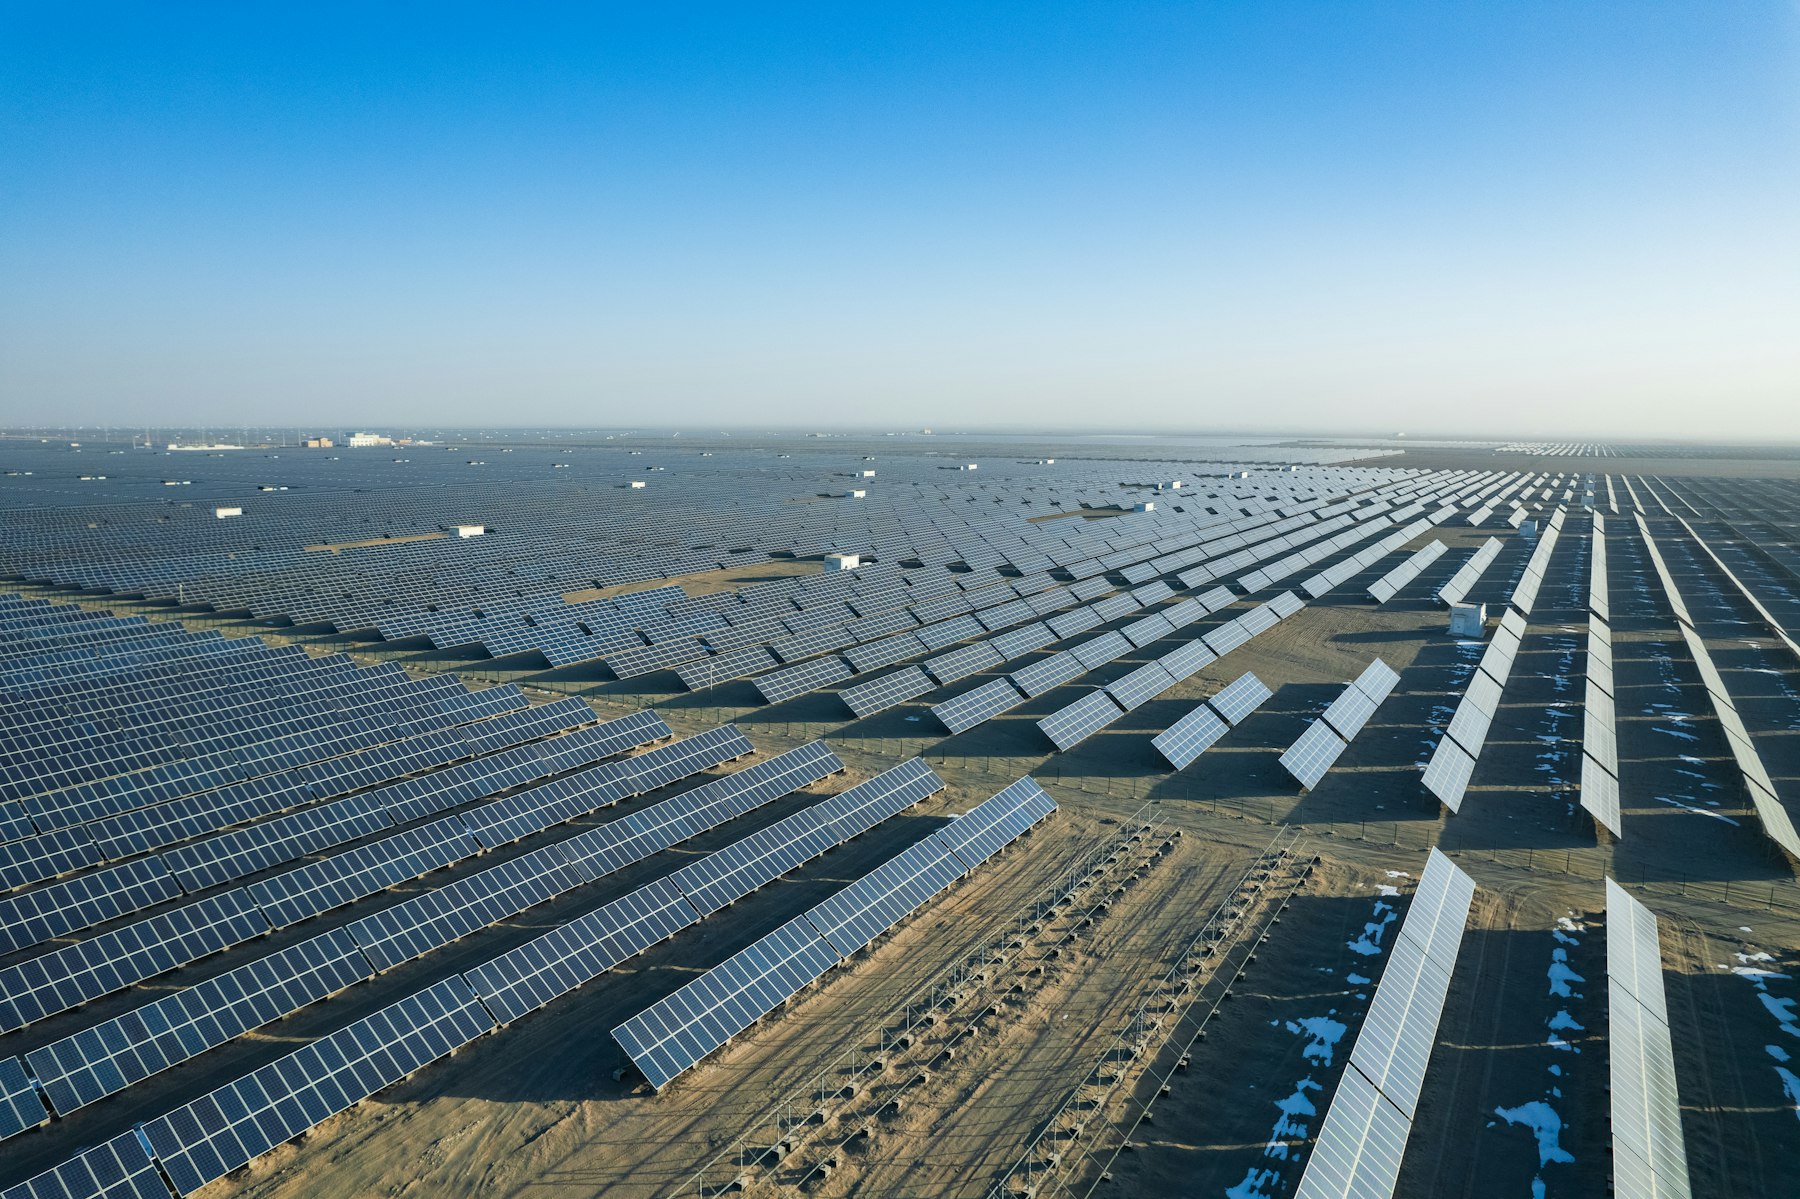
Aerial view of a solar farm in Dunhuang, China. Photo by Darmau Lee on Unsplash.
Overview
Identifying viable sites for renewable energy development is a multi-layered spatial problem. Candidate areas must be evaluated against a wide range of criteria — regulatory setbacks, infrastructure proximity, terrain, land cover, and more — and those criteria shift depending on the project type (solar, wind, storage) and the regulatory environment of the region.
This project tackles that problem with a structured, repeatable workflow: assembling the right data, preparing it for analysis, running a weighted multi-criteria assessment, and delivering the results in formats that are useful to both developers and resource analysts. Applied to professional project development work at Liberty Utilities and REV Renewables.
Workflow
- Data Collection: Source data was gathered from multiple streams: open source datasets (government land registries, environmental layers, infrastructure networks), purchased data, and consultant-supplied datasets. Each source required its own processing, and validation before it could be used in analysis.
- Data Preparation: Raw inputs were cleaned, reprojected to a common coordinate system, and integrated into a unified spatial dataset. Inconsistencies across sources such as: differing attribute schemas, overlapping geometries, gaps in coverage, were resolved before any analysis was run.
- Multi-Criteria Analysis: Sites were evaluated using a model that accounts for hard exclusion constraints (setbacks, protected areas, restricted land use) and scored criteria (proximity to transmission, slope, parcel size, land cover suitability). Constraint buffers adjust dynamically based on the selected project type and regional regulatory strictness, so the same workflow applies across different scenarios without tedious reconfiguration.
- Automated Processing via ArcGIS Toolbox: The analysis logic was built in Python using primarily ArcPy, some Rasterio and GeoPandas, and connected to a custom ArcGIS Toolbox, giving the wider project team a familiar interface to run the full workflow themselves. This includes inputting project type, study region, and regulatory parameters, without needing to interact with the underlying scripts.
- Visualisation: Results were written back to ArcGIS Pro as map layers, creating maps to show the potential of an area of interest, and to be a visual aid in decision making.
- Analyst Outputs: Alongside the visual deliverables, structured data exports (shapefiles, kml) were produced for resource analysts, containing attribute tables with relevant information.
Technologies Used
- ArcGIS Pro: Spatial Analyst, Symbology, Labelling, Map Series
- Python / ArcPy: Automated geoprocessing, dynamic parameter logic, batch data preparation
- ArcGIS Toolbox: User-facing interface for non-technical team members, and ease of use
- Data Sources: Open source, purchased, and consultant-supplied spatial datasets
Key Outcomes
The workflow replaced repeated, manual steps with a consistent, repeatable process that the full team could run independently, and more quickly. Developers received clear visual outputs showing site potential, while resource analysts received structured data files ready for detailed evaluation. The dynamic project type and regulatory parameters made the tool practical across multiple regions and energy types, significantly compressing the time from initial site screening to a shortlist of viable candidates.